Understanding Payoff Charts
Option payoff diagrams are profit and loss charts that show the risk/reward profile of an option or combination of options. As option probability can be complex to understand, P&L graphs give an instant view of the risk/reward for certain trading ideas you might have.
If you've never seen a payoff chart, then below we'll go through two examples of what the P&L looks like for an easy long call option (buying a call) and then a short call option (selling a call).
7 Days of Option Lessons Delivered to your Inbox Show Me More »
Call Option Payoff
Let's look again at the basics of a Call Option. Here is an example;
Underlying: MSFT
Type: Call Option
Exercise Price: $25
Expiry Date: 25th May (30 days until expiration)
The market price of this call option $1.2. Buying the option means you pay this price to the seller. As the option is a call option, exercising the option means you will buy the shares at the exercise price of $25. You would only exercise if it is profitable to do so. But the exercise price alone is not doesn't determine probability.
You also need to consider that you paid something to have the right to exercise; the option premium, in this case $1.20. Therefore, the shares have to be trading at $26.20 for us to break even (Exercise Price of $25 plus the Option Premium of $1.20). If the shares are trading anywhere above $26.20 then we can say the option is profitable. Anywhere below $26.20 and we lose out by the premium - $1.20. So, with a long call we have limited risk (the Option Premium) while at the same time having uncapped profit potential. Let's look at a graph of this concept;
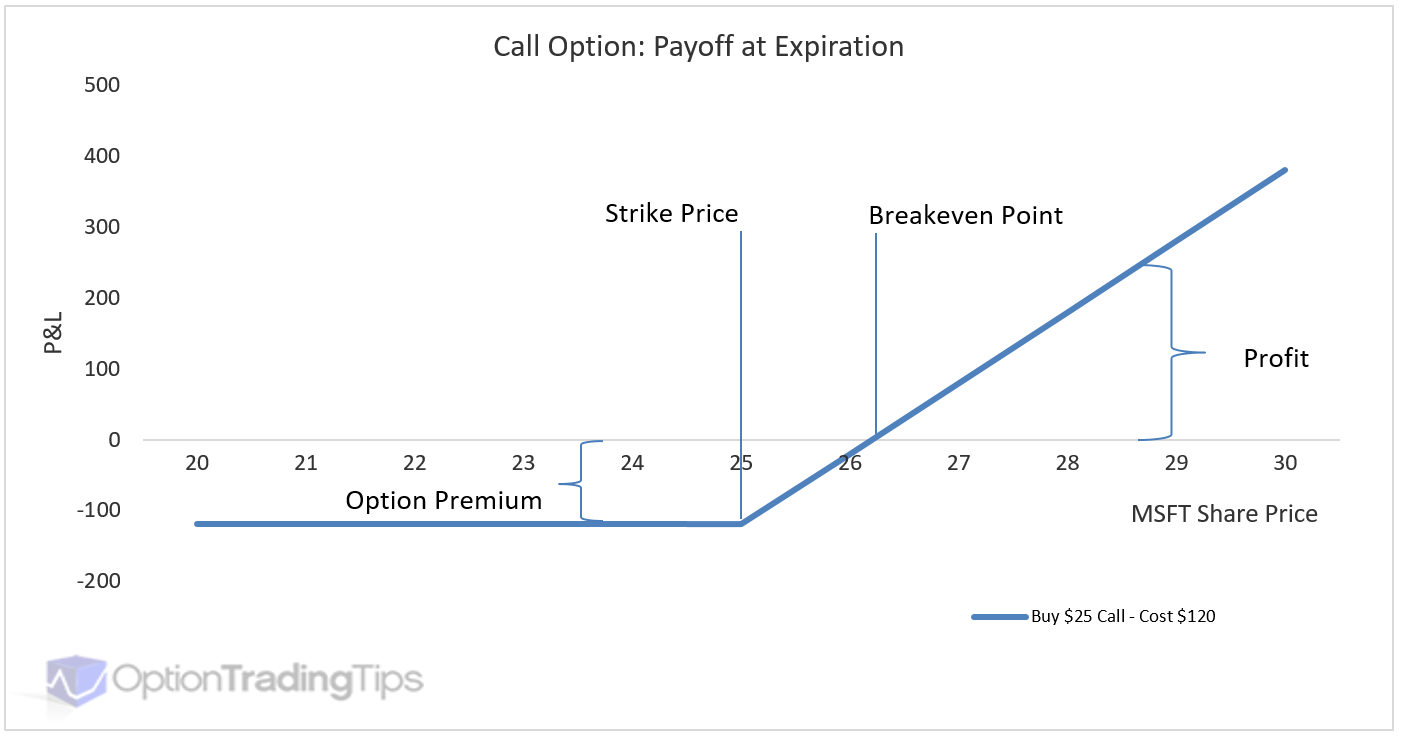
The horizontal line across the graph (the x-axis) represents the price movement of the underlying instrument - in this example, the share price of Microsoft. The vertical axis illustrates our profit/loss. The blue line is our payoff of our option position.
You can see that the vertical distance between the 0 profit line and the blue line is our maximum loss, i.e. the amount we paid for the option. So, anywhere under our break even point of $26.20 means that the option isn't profitable, we will not exercise the option and we will lose any premium we paid ($1.20). Even if the market crashes and the stock goes bankrupt, our maximum loss will still only be the premium we paid.
However, as the shares trade past the $26.20 mark we start making money on the position. If, at expiry, Microsoft shares are trading at $50 then we will make $23.80 per share. How? Because we will exercise our right and have the seller of the option hand over Microsoft shares at a value of $25 (the exercise price). Minus the amount we have already paid for the option ($1.20) and we have a profit per share of $23.80.
Selling a Call Payoff
When we reverse the position and sell a call option, here is the payoff diagram for that.
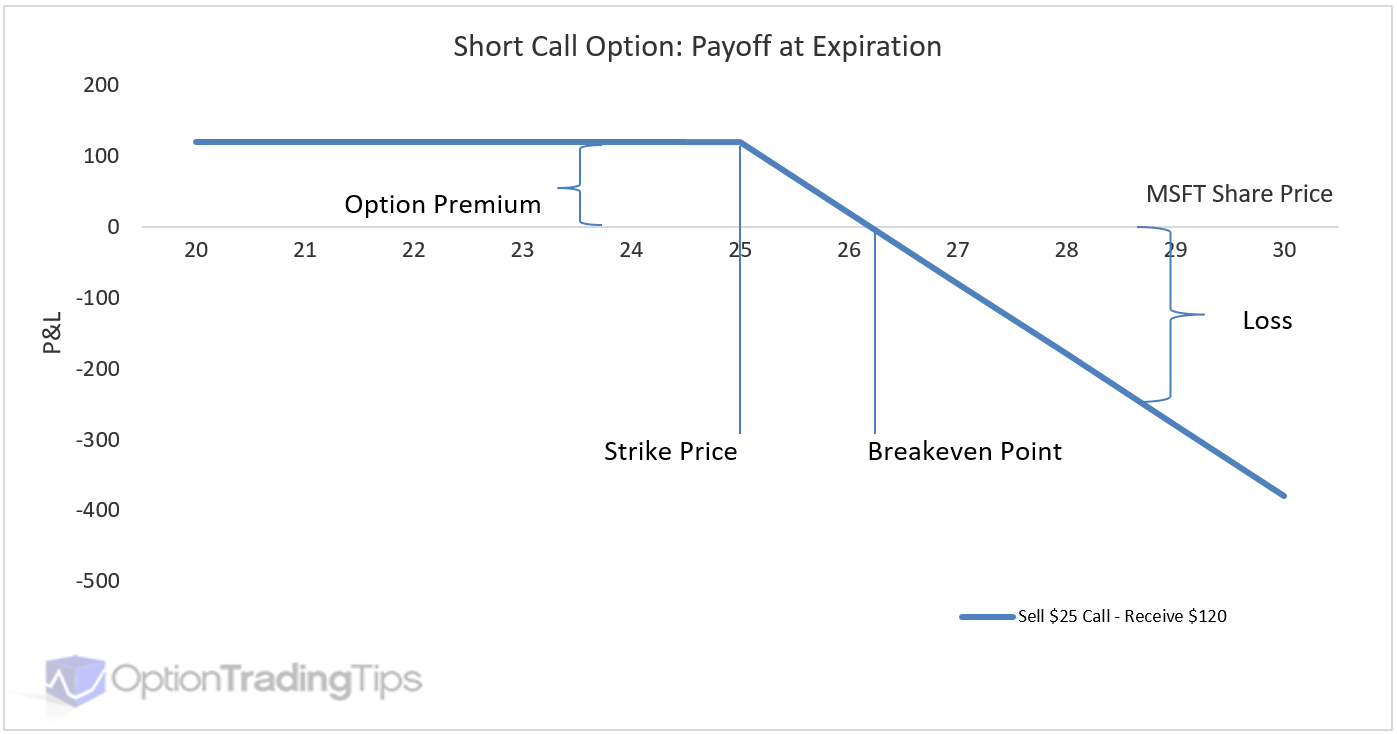
We have the same format of stock price on the x-axis (horizontal) and P&L on the y-axis (vertical). Because we sold the call, we receive money for the sale, which is the premium. If the shares trade anywhere below $25 then we keep the $1.20 that we received when we sold the call option.
However, if the market rallies then our losses become uncapped as the stock price rises.
Theoretical P&L vs Payoff at Expiration
The above graphs have looked at what option will be worth at the expiration date only. However, you will often see another line inside payoff charts that is usually smooth and referred to as the Theoretical P&L.
This theoretical line graphs what the option is worth today and is calculated from a theoretical pricing model, such as Black and Scholes or Binomial Model. Given the time to expiration, the graph will show how your P&L will change "today" should you have this position vs the axis graphed; usually the stock price.
Here is the same MSFT call option chart now with theoretical P&L added.
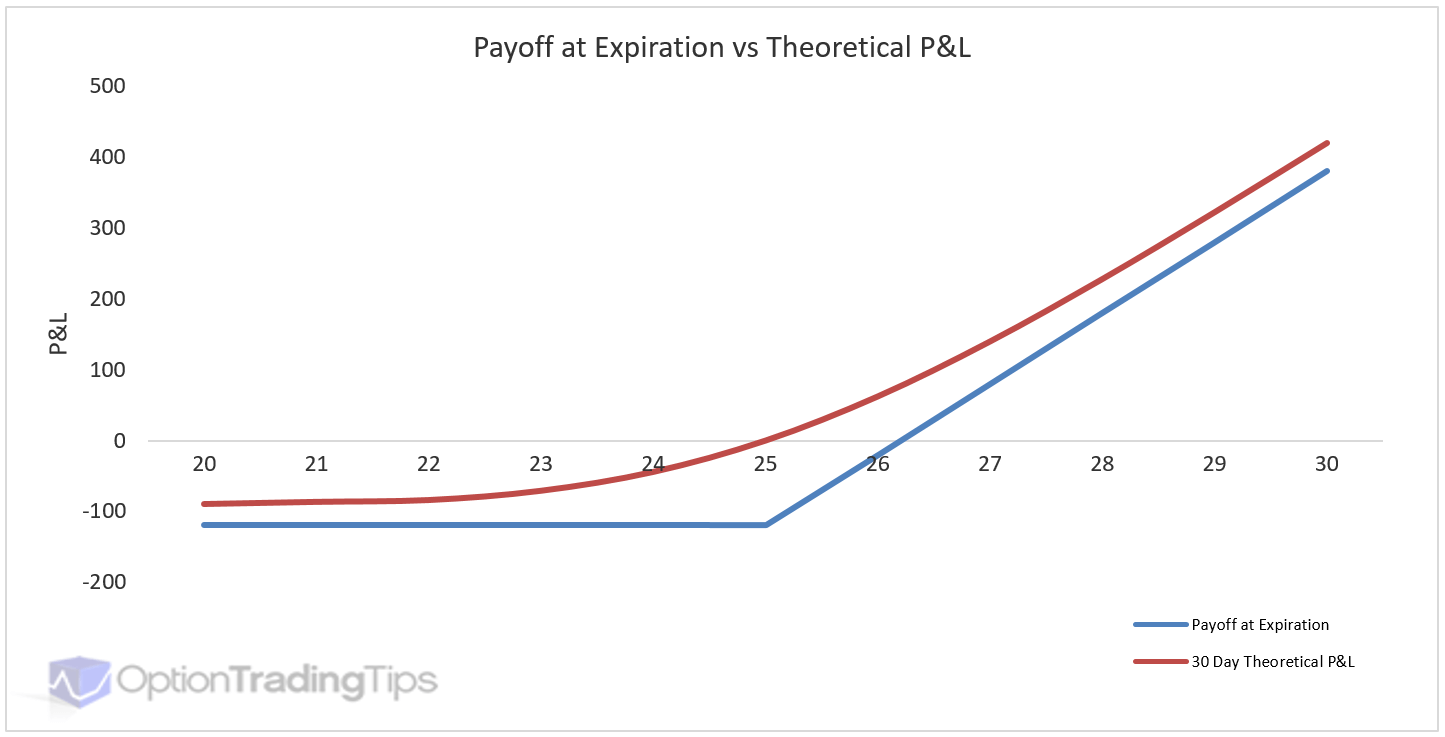
The place on the x-axis that represents the current stock price should be where the P&L is zero i.e at the time and stock price of purchase you have not made or lost anything. The payoff line at the same point on this chart is the premium, or price, of the option. (This isn't always the case though regarding the premium for the option and the payoff/P&L line. For certain combinations it can be either the premium or max profit/loss.)
This example was calculated when the option has 30 days until expiration and is worth $1.20. With all other things being equal (time, interest rates, volatility) the smoothed line shows how the P&L will change for each corresponding price movement of the stock as per the axis.
As each day passes, this line will move closer and closer until the point of expiration, which will be the final payoff line.
Combination Payoffs
Outright calls and puts are fairly straight forward to understand when it comes to payoff and P&L. However, payoff charts become very useful when looking at combinations of options i.e. when more than one leg is in the strategy.
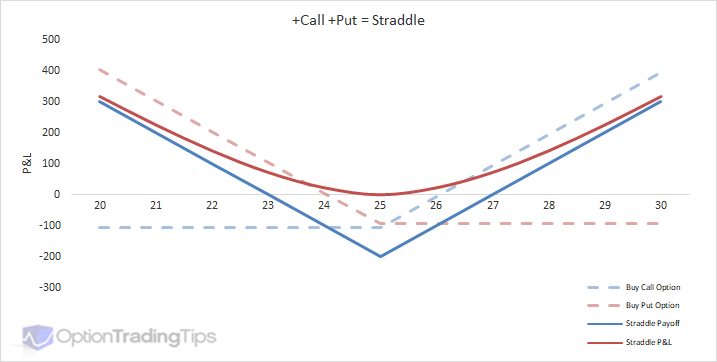
Take an option straddle for example. A straddle is a combination of two options; a long call and long put option with the same expiration dates and strike prices. Below is a straddle graph.
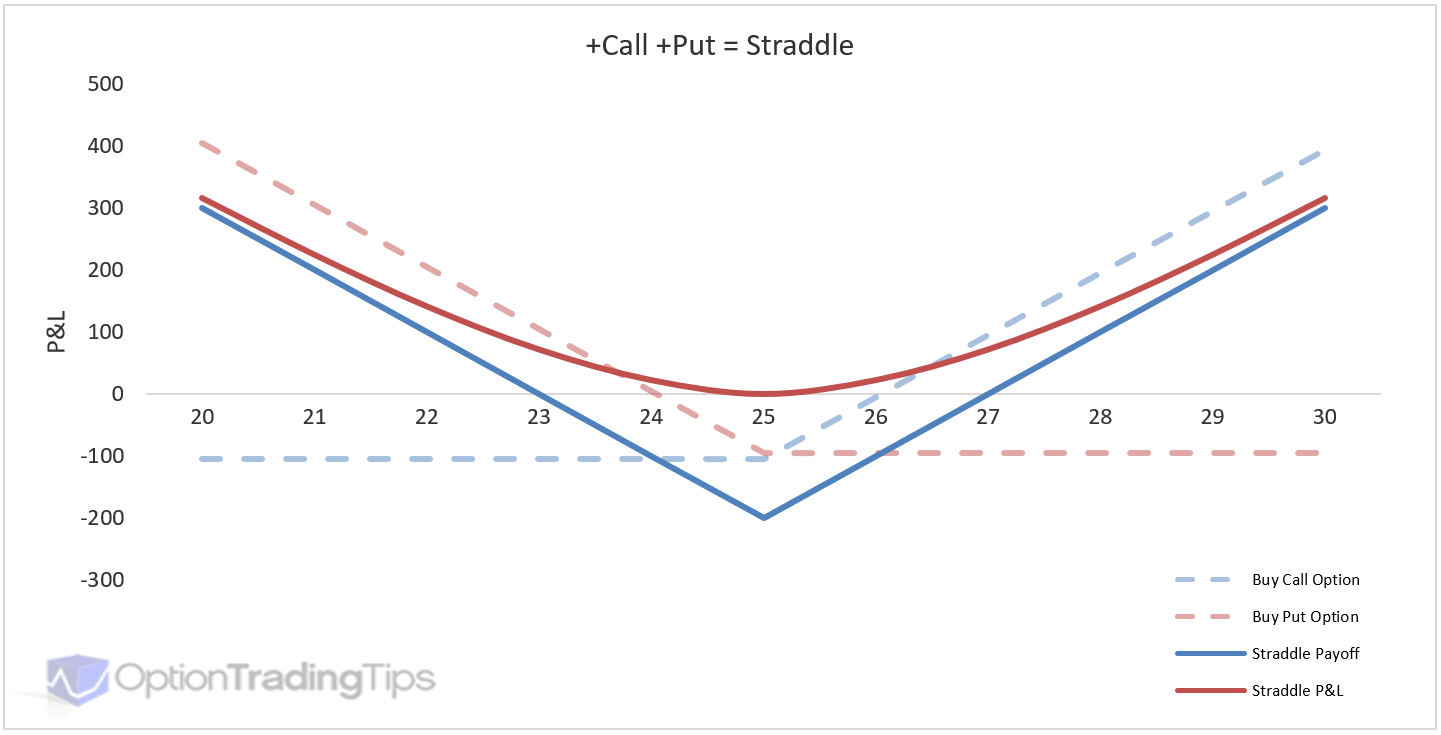
Typically when you see combinations charts you will only have the total of all legs plotted. Here, I've plotted each single leg, buy call and buy put, in a lighter color and dashed in the background and then the combination as the darker solid line in the foreground. The P&L line is for the combination.

38 Comments
Peter February 6th, 2017 at 4:11am
Hi Ali,
Yes, fair point there. The graphs label the blue line as P&L; some of the content probably needs to be updated. Thanks!
Ali February 5th, 2017 at 4:10am
Dear author,
I am sorry, But the "blue line" you talked about is the "Profit".
Its not the payoff. Payoff is the line which doesn't represent the impact of the Future values of costs and Premiums paid or received.
Actuarial Student
mahesh February 26th, 2015 at 5:02am
thanks
Peter February 25th, 2015 at 6:54am
Hi Mahesh,
The option will be worth at least its' intrinsic value - for a call option it will be the stock pice minus the strike price. So, there will always be a buyer at this price - typically a market maker who will offset it against the stock or another option.
You could also exercise the option (if a call) and take delivery of the stock and then sell it immediately in the open stock market to realise the gains.
mahesh February 25th, 2015 at 6:27am
hi
if i baught xyz call at 5 and after a week it is 25 .but now it has no buyer at this value
what should i do should i buy put of same strike prise ?
explain profits in that case
Peter August 29th, 2012 at 7:19pm
Hi Migh,
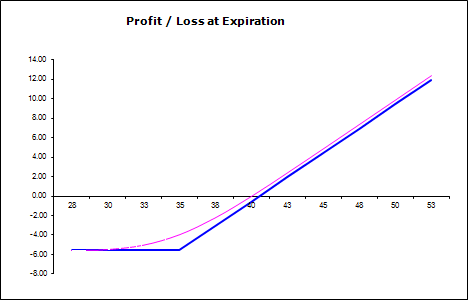
Sure, here's a payoff graph of a $35 call option with 60 days to maturity, 25% volatility, 0% dividend yield, 8% interest rate and an underlying price of $40.
migh August 24th, 2012 at 3:06am
suppose a stockm price is 40 and effective annual interest rate is 8%.draw a single payoff and profit diagram for the following option
strike price is 35 with premium of 9
Peter February 15th, 2012 at 10:17pm
I'd say the best way to trade is to paper trade your ideas. If you don't want to wait until opening a brokerage account before testing then you can use an application like Visual Options Analyzer [link removed as the product no longer exists] where you can enter trades and manage them against downloaded option prices.
Jon February 15th, 2012 at 4:04pm
So what would be the best way to just 'test the waters' without extreme risk of loosing a lot of money? The least risky version of options trading?
Peter February 6th, 2012 at 8:28pm
If the option expires worthless, yes, you will always keep 100% of the premium received.
Add a Comment